With Construction industry still one of the highest categories for fatalities at work at First4safety ltd we were appalled to hear the news and reports that certain
training organisations for certifying builders were being caught rigging health and safety exams. Construction workers across the UK are required to hold a CSCS
card to prove skills and grasp of health and safety. But a joint BBC London/Newsnight investigation revealed widespread, organised cheating, allowing untrained
builders on to dangerous sites. As the report pointed out Construction is the UK’s most dangerous employment sector.
More construction workers were killed than members of the armed forces during the Afghanistan war. In the past five years alone, 221 workers died.
Fatal Injuries in the workplace in 2015
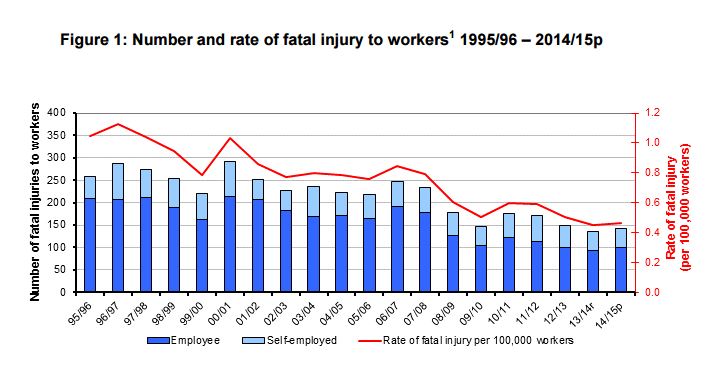
The provisional figure for the number of workers fatally injured in 2014/15 is 142.
The figure of 142 worker deaths in 2014/15 is 9% lower than the average for the past five years (156).
The finalised figure for 2013/14 is 136 worker fatalities.
Over the latest 20-year time period there has been a downward trend in the rate of fatal injury.
There were also 102 members of the public fatally injured in accidents connected to work in 2014/15 (excluding railways-related incidents).
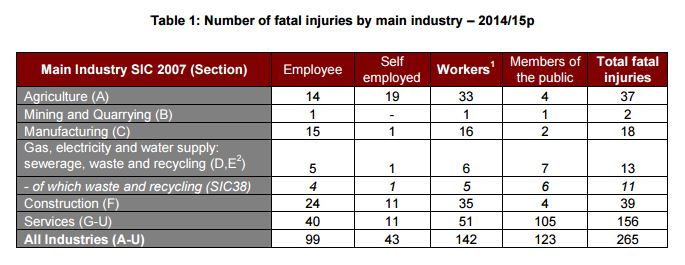
For main industry sectors in 2014/15:
Construction: There were 35 fatal injuries to workers in construction, 22% lower than the five year average of 45.
Agriculture: There were 33 fatal injuries to workers in agriculture, the same as the five year average (33).
Mining and quarrying: There was one worker was killed, compared to an average of five deaths for the previous five years.
Manufacturing: There were 16 fatal injuries to workers in manufacturing, 33% lower than the five-year average (24).
Waste and Recycling: There were five fatal injuries to workers in waste and recycling, compared to the five-year average (6) but subject to considerable yearly fluctuations.
Services: There were 51 fatal injuries to workers in services, 21% higher than the average for the past five years (42).
Members of the Public There were 123 members of the public fatally injured in accidents connected to work in 2014/15. Of these deaths, 21 (17%) related to incidents occurring on railways
Comparison with other countries
Global comparisons, for example, with the USA, Asia etc. are difficult due to differences in definitions of workplace accidents and reporting systems, as well as the variation in internal industry structures. However, some basic comparisons with other European countries are possible through data compiled by the statistical authority for the European Union (Eurostat).
Since 1990 Eurostat has worked with member states on a harmonisation programme to give consistency to workplace injury statistics across the EU. To take account of differing industrial backgrounds across member states, Eurostat publishes standardised incidence rates.
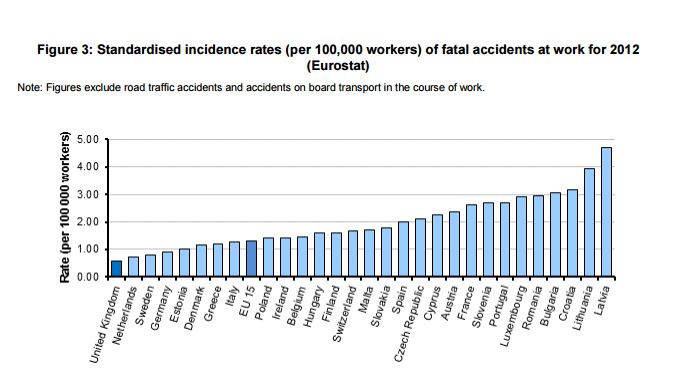
The standardised rate of fatal injury for the United Kingdom in 2012 was 0.58 per 100,000 workers, and compares to a three-year average rate of 0.67.
The UK rate for 2012 was considerably lower than the corresponding EU-15 rate (1.3 per 100, 000) and that of many other EU member states, including the large economies of Germany (0.9), Italy (1.29), Spain (1.99) and France (2.64). The GB three-year average rate (2009-2011) was one of the lowest across all EU member states. Standardised rates published by Eurostat are based on fatalities occurring across all main industry sectors, excluding the transport sector.
The level of fatalities in the workplace has been summarised from a government document https://www.hse.gov.uk/statistics/fatals.htm